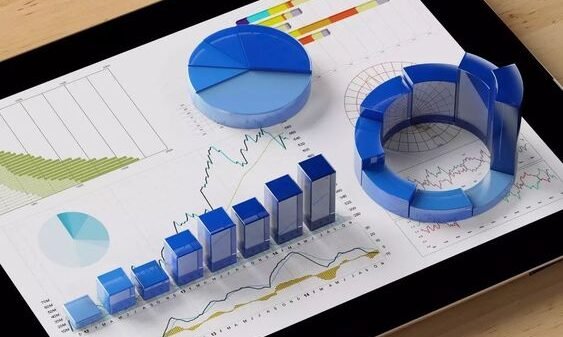
TradingView is one of the most powerful charting software on the market, and in this guide, I’m going to show you how to take advantage of this software to improve your trading strategy.
TradingView is so much more than a charting tool. You can use it to analyze charts, backtest trading strategies, and test indicators and strategies in real-time.
This software is hugely popular among professional traders, and for good reason – It’s intuitive, easy to use, and it offers a ton of customization for traders of all skill levels.
In this article, we are going to show you how to use TradingView to find trading opportunities and to identify the best times to trade certain assets using technical indicators and chart patterns.
Now let’s get started.
What is TradingView Charting Platform?
TradingView is an online charting platform that allows you to create and customize your charts based on your trading strategy.
It allows you to create and backtest your strategy using historical data, and even lets you share your charts with others so they can see what you’re doing.
This free platform was created by traders for traders, so it contains all of the features you need for trading success.
Best of all, it’s very easy to use, so even if you’re a beginner, you can start using it right away.
If you’re already using TradingView, then you already know how powerful this tool can be to a trader.
And if you’re not using it yet, then now is the time to start!
So let’s take a look at how to use this powerful platform to improve your trading results.
Improve Your Trading Strategy with TradingView Software
TradingView is a platform that provides charts and technical analysis tools for traders and others interested in financial markets.
TradingView’s website provides charts of stocks, indices, commodities, and cryptocurrencies with customizable indicators and drawing tools. You can upload your own charts or subscribe to others from the website’s community.
What makes TradingView unique compared to other charting platforms is its community aspect.
TradingView’s charts and drawing tools include features that are not available on other charting websites such as drawing tools, indicators, and drawing tools not available on other platforms.
TradingView’s charting tools and indicators are customizable. Users can add their own indicators and drawing tools to their charts or subscribe to others’ charts or indicators for no charge.
TradingView is a market charting and technical analysis platform that’s used by millions of traders around the world.
I’ve been using TradingView for years, and I absolutely love it. It’s by far the best technical analysis software out there.
TradingView Reviews
- TradingView is a social trading platform that enables users to view charts, place trades, and communicate with other users in real-time.
- It’s free to use and has many features – including multiple chart types, a watchlist, custom indicators, and much more.
- TradingView allows you to analyze multiple charts at the same time as a part of your subscription package.
- TradingView also allows you to download an image file of the charts on the platform so that you can view them offline.
- The platform is free to use and you don’t have to pay anything to use it.
- You can also share charts with your colleagues, friends, and family.
- You can also create a watch list of stocks that you want to watch and stay up to date on their price movements.
- TradingView provides charts with technical indicators such as Bollinger Bands, Moving Averages, MACD, RSI, and others.
- The charts are customizable and you can add your own indicators, lines, and colors to the charts.
- You can also create custom charts on the platform using data from a number of different sources.
- TradingView also provides financial news and commentary from a number of sources so that you can stay up to date on your investments without having to spend hours reading multiple news stories and articles.
- TradingView also provides a number of community features such as group discussions and forums where traders discuss market topics or trade ideas.
- The TradingView platform is available on all devices including PCs, Macs, tablets, and smartphones.
- TradingView also has a mobile web app that you can use on your smartphone or tablet to access your account on the go.
- If you haven’t used this amazing charting tool, you’re missing out on one of the best trading tools available today.
How to Draw Trendlines and Channels to Determine Possible Reversals
When trading price action, it’s important to draw trendlines and channels to determine possible reversals. Without proper market analysis, and an understanding of support and resistance – you could lose a lot of money in the market.
The trendline is the simplest form of technical analysis because it tells a trader exactly where the market is in relation to its past price action. Trendlines are lines drawn to connect the highest prices and lowest prices over a series of prices.
Channels are lines drawn to connect the highest prices, lowest prices, and middle prices over a series of prices. The prices that are closest to the lines are considered support and resistance. When the price breaks through these levels, it is considered a reversal in price direction.
Learn to find these levels and draw the trend lines that connect them. This will help determine possible reversals.
How to Use Technical Indicators to Identify Trend Directions
Technical indicators are the lifeblood of technical analysis.
They help us identify trend directions and trend reversals, and they provide insight into where support and resistance levels are located. However, there are a few things you need to understand about technical indicators before you go about using them.
Technical indicators are tools used in technical analysis to determine trends in the market. They can also help traders identify potential trades.
Traders use technical analysis because they are more reliable than fundamental analysis in forecasting market direction.
Technical analysis consists of charting price movement over time using indicators such as moving averages, oscillators, and trendlines, among others.
Technical analysis is based on the premise that human emotions influence price movement in financial markets. In other words, human emotions affect how traders buy or sell stocks and other securities.
Emotions such as fear, greed, and hope cause stocks to move up or down. Therefore, technical traders look for patterns in the market that can help them forecast future market direction.
These patterns can take the form of price/volume ratios, price patterns, and trend lines.
Technical indicators can be used to identify trends and help traders identify opportunities in the market.
How to Use Volumes to Determine The Market Strength
The key is to identify which type of day the market is trading on and act accordingly.
Volumes are one of the most important trading indicators – They tell you exactly when to buy or sell, and where to place your stops. Unfortunately, most traders don’t pay any attention to volumes because it’s hard to interpret them in real-time. But if you know what to look for, volumes can be a very powerful trading tool that will help you make better trades.
Trading volumes are the number of shares traded during a given period of time. Volumes are a fundamental indicator of market strength. When deciding to enter a trade, consider using volume to help determine whether the market strength favors you or the market.
Volume is quantified by the total number of shares traded during a certain period of time. Usually, a one-day period is used to measure volume, but you can use longer time frames as well.
Volume can be a good indication of the market strength. The more people trading the more interest in a stock or market there is. If more people trade, it’s a good sign the market is doing well.
On the flip side, when the volume is low, it’s a good sign the market is either consolidating or going down. Volume can be a good tool to use to help determine whether the market is moving up or down and can be used in conjunction with other indicators to help measure market strength.
Remember though, volume alone can be misleading. For example, if a stock is doing well, the volume will usually increase as traders buy the stock. As a result, volume can often only tell half the story.
Volume can also be misleading when the stock is in a steady uptrend or downtrend. However, it can be used in conjunction with other indicators to help determine the strength of the trend.
How to Use Chart Patterns to Determine Potential Trends and Reversals
Chart patterns can be extremely profitable if you know how to use them properly.
There are two main ways to approach chart patterns –
- You can trade intraday patterns like the head and shoulders or double top/bottom.
- You can trade more long-term patterns like the ABCD pattern or rounding bottom formation.
Unfortunately, most traders are completely clueless when it comes to understanding chart patterns.
That’s why you’ll need to learn how to use chart patterns for maximum profit potential and success as a trader.
A chart pattern is a fractal that repeats itself over and over again. When a chart pattern is forming, it signals potential trend reversals.
If you can identify these patterns, you can potentially make significant profits by trading the trends.
Many professional traders at Wealthy Education have made their fortunes by using just one or two chart patterns and taking short trades when those patterns are forming or when the price breaks the pattern.
Others look for confirmation on other technical indicators before taking the trades.
The key to using any type of technical analysis is learning how to combine different technical indicators with price action for maximum success and profitability as a trader.
Key Takeaways
Trading with a charting software like TradingView can be profitable if you know what you’re doing – But it takes a lot of practice to master.
If you want to become a successful trader, you need to stay consistent and focused. Once you start making money, you need to stick with it through thick and thin.
And in order to do that, you need to follow a proven trading system. A proven trading system will help you minimize your losses and maximize your potential gains.
There are tons of trading strategies out there but you need to find one that resonates with you and that fits your personality so you can stick to it over time.
You also need to learn to think like a contrarian and use the power of the crowd to your benefit as much as possible.
Never follow the crowd blindly – Always look under the hood first.
Once you understand how the market works, you’ll start to make money consistently – and that’s what trading is all about.
Suggested Reads:
How The Google Pixelbook 12in Has Improved In 2022!
Best Routers For Multiple Users And Which One Should You Choose


